Fellow Intranet offers a wide range of analytics about the usage of your platform.
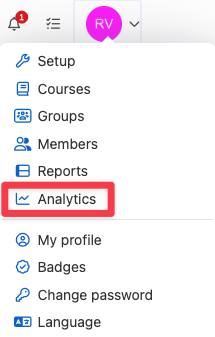
Managers have access to the analytics of the complete platform. They can find the complete set of analytics in the user dropdown.
Filters
The metrics can be filtered by spaces, period, groups and types. After filtering you will see the results of the metrics for the specified timeperiod, space or group.
Definitions of metrics
Active member: A member who has logged in on the platform at least once in the reporting period. So if the member visits the platform (website/app) more than once, he will be counted as one member only.
Visit: A visit starts when the member arrives at the platform (website/app) and contains all activity afterwards. After 1 hour of inactivity on the website or 2 hours of inactivity in the app the visit will be considered ended. New activity of the same user after that period will be registered as a new visit.
Pageviews: The number of spaces and items that are viewed by users during the selected period.
Pageviews / Member: Pageviews per member measures how many items a member on average sees during his selected period. The number is calculated by dividing the total number of pageviews by the total number of members.
Items: This number is the total number of items that are added by users during the selected period.
Replies: This number is the total number of reactions that are given by users during the selected period.
Likes/dislikes: This number is the total number of likes and dislikes that are given during the selected period.
Trends
Below the metrics you will find trendboxes with an arrow point upwards or downwards. This metric will show you the trend of the usage compared to the period before. (If your timefilter shows a month, the trend compares the current month with the same period before.)
Top contributors
Below the standard contributors we offer an overview of members that contribute the most to the platform.
Analytics in detail
On the bottom of the analytics page you will see a detailed overview of activity in spaces and by items. Again these analytics can be filtered with different filter options (activity and highest/lowest). You can export the analytics in an XLS document for offline usage and for integration in other tools.