Overview
- Downloading reports
- Your own custom report
- Saving and reusing filters
- Filtering out confidential information
- Sending reports automatically via email
- Statistics
- Exports
Downloading reports
With the ready-made reports in Coursepath, you can download an Excel file with just a few clicks of the mouse. With a large number of participants, however, these reports can quickly become extremely comprehensive. They may also contain details that are not particularly important to you. Or they may include confidential details that are irrelevant or even forbidden for the person viewing the information.
Coursepath provides a variety of filter options that allow you to tailor a course evaluation to your needs.
Your own custom report
Use the detailed filter options at academy or course level to receive custom reports. This is how you define in advance which categories or members are to be found in the download file.
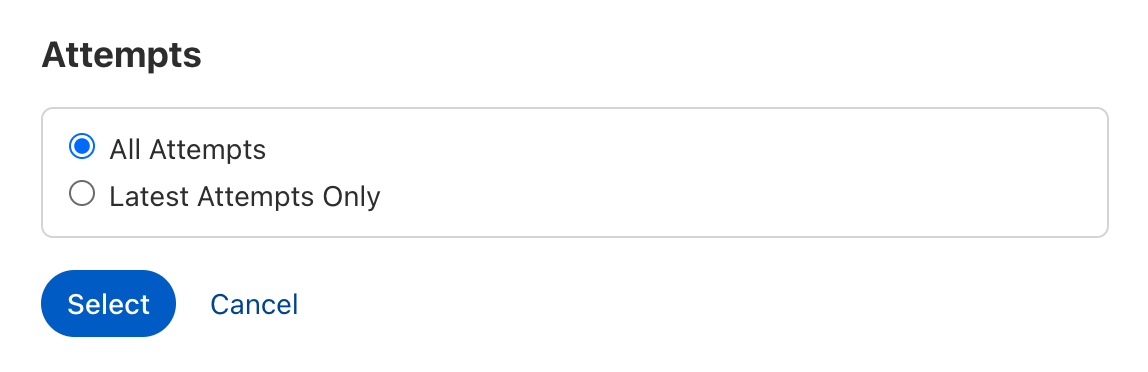
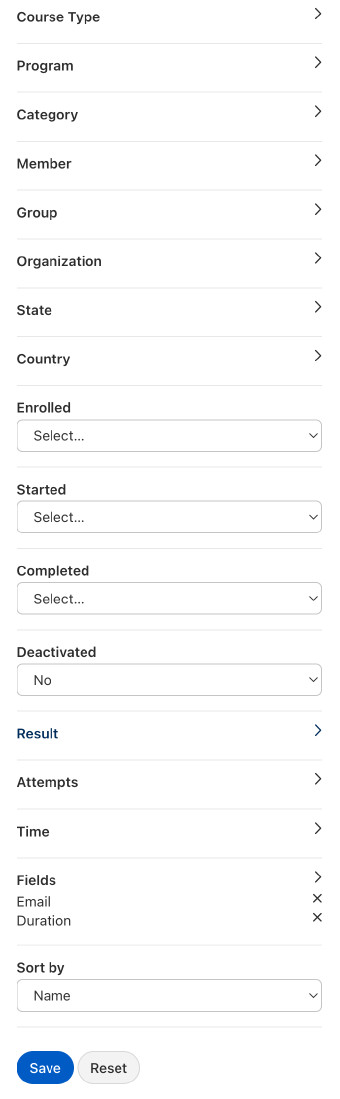 You can use the Attempts filter to decide whether you want to see all the participants' attempts in the report or just the most recent attempt.
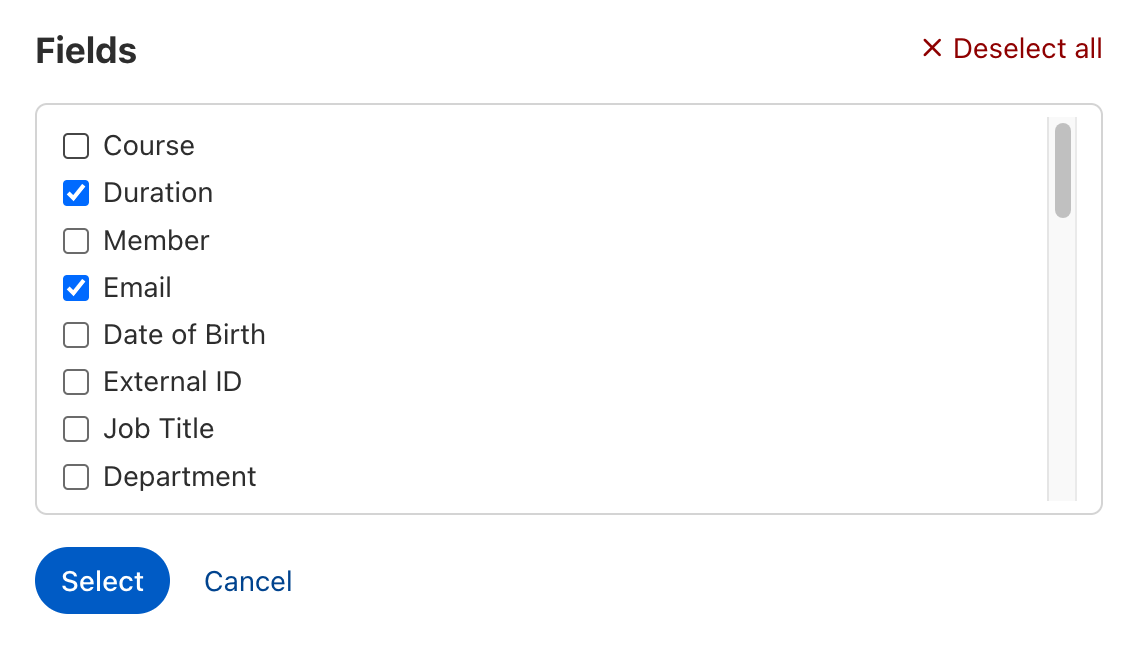
 Compile your reports precisely and individually by selecting in advance which information is displayed in the reports. Use the Fields filter in the reports to do this. Then select the checkboxes for the columns that you want to display in your report.
 Tip: The filters give you the option to remove specific information from the reports. This makes it easier, for example, to create reports for external auditors tasked with assessing the quality of your audits, without granting them access to personal data. Simply save the relevant reports in your personal filters.
Saving and reusing filters
Are you always filtering for the same groups? Or are you always searching for the same learning steps for specific user groups? You can save frequently used filter settings.
To save your personal filters, simply follow the steps described here:
1. Select Reports
- To do this, click “Reports” in the academy menu bar
- Or click “Reports” in the course menu and select “Reports” again. The filter for the corresponding course is already set in the selected repor
2. Select the desired filters
3. Click Save
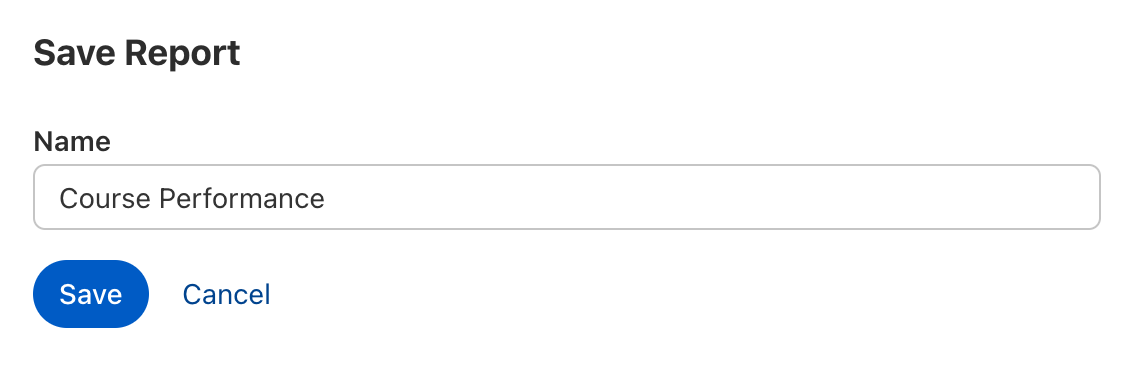
4. Enter a name for the report
Choose an easy-to-understand name that will help other employees to identify the purpose of the report (i.e. “Report - District Management North” rather than "Report 1")
5. Click Save
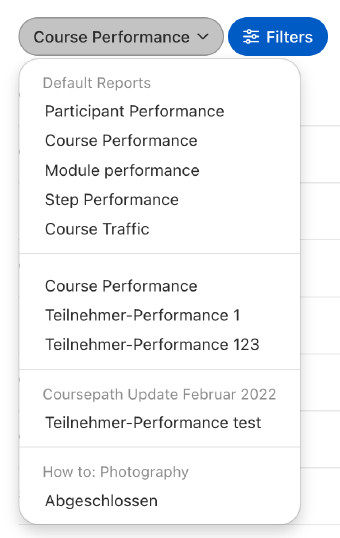
 You can open a report saved in this way at any time using the drop-down menu in the reports. The saved reports are grouped here according to the courses to which they relate. Reports that include more than one specific course can be found in the listing just below the preconfigured reports.
Filtering out confidential information
Confidentiality problems often arise faster than expected. What happens, for example, with a course attended by employees from several different areas or departments? Not every area or department head should be able to view all the reports or all the participant data.
Tip: Simply apply appropriate filters including fields to the reports in question (columns in the Excel download file). Each area or department head receives a custom report with the participant and progress data from their own area of responsibility. Persons from outside the department will not receive this data.
Sending reports automatically via email
After saving your custom reports, you can have them sent automatically via email. The best thing about this option is that the email recipient does not even have to be a member of the academy. This means that a department manager who wishes to be informed about the learning progress of his employees does not necessarily have to be a trainer in the academy or the course. The reports are sent as Excel spreadsheets.
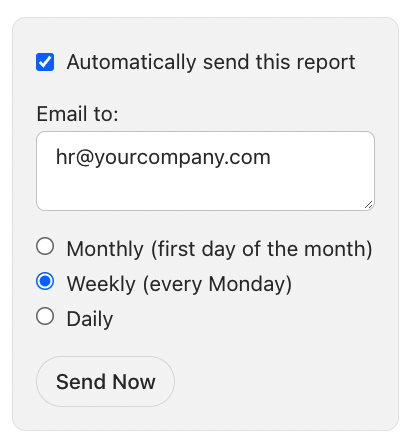
Proceed as follows to send the Excel reports automatically:
1. Save your personal filter
2. Enter the email address of the recipient in the screen o Use commas to separate multiple recipients
3. Choose the frequency for the report emails o You can choose the first day of each month, every Monday, or daily
 Examples
Instead of forwarding specific reports to the persons responsible after downloading them, you can have the Learning Management System do this automatically. For example, you can have the sales rep report sent automatically to the sales management, or the Division Manager West can receive their team's results automatically at the beginning of each month.
Another example: At the beginning of the month, you invited new participants to your course and now at the beginning of each week you want to be able to see who has started learning and who has not. This can also be done using automatic email reports. Select the desired filter and have the LMS send it to you automatically via email every Monday.
Statistics
The participant diagram includes three pie charts.
The chart on the left displays the following data:
- Total number of learners on the course
- Started/Not started and Completed
- Passed/Failed on
The middle chart displays average result data.
The chart on the right displays the result distribution. “How many learners have completed 91-100% of the course”, for example.
All the charts can also be filtered by user group.
Tip: If students are assigned the “Passed” status manually by the instructor, it is possible that they have passed but have not yet completed the course. Similarly, a student may have completed the course but failed to pass. However, the total number of participants is identical in both pie charts (inside and outside).
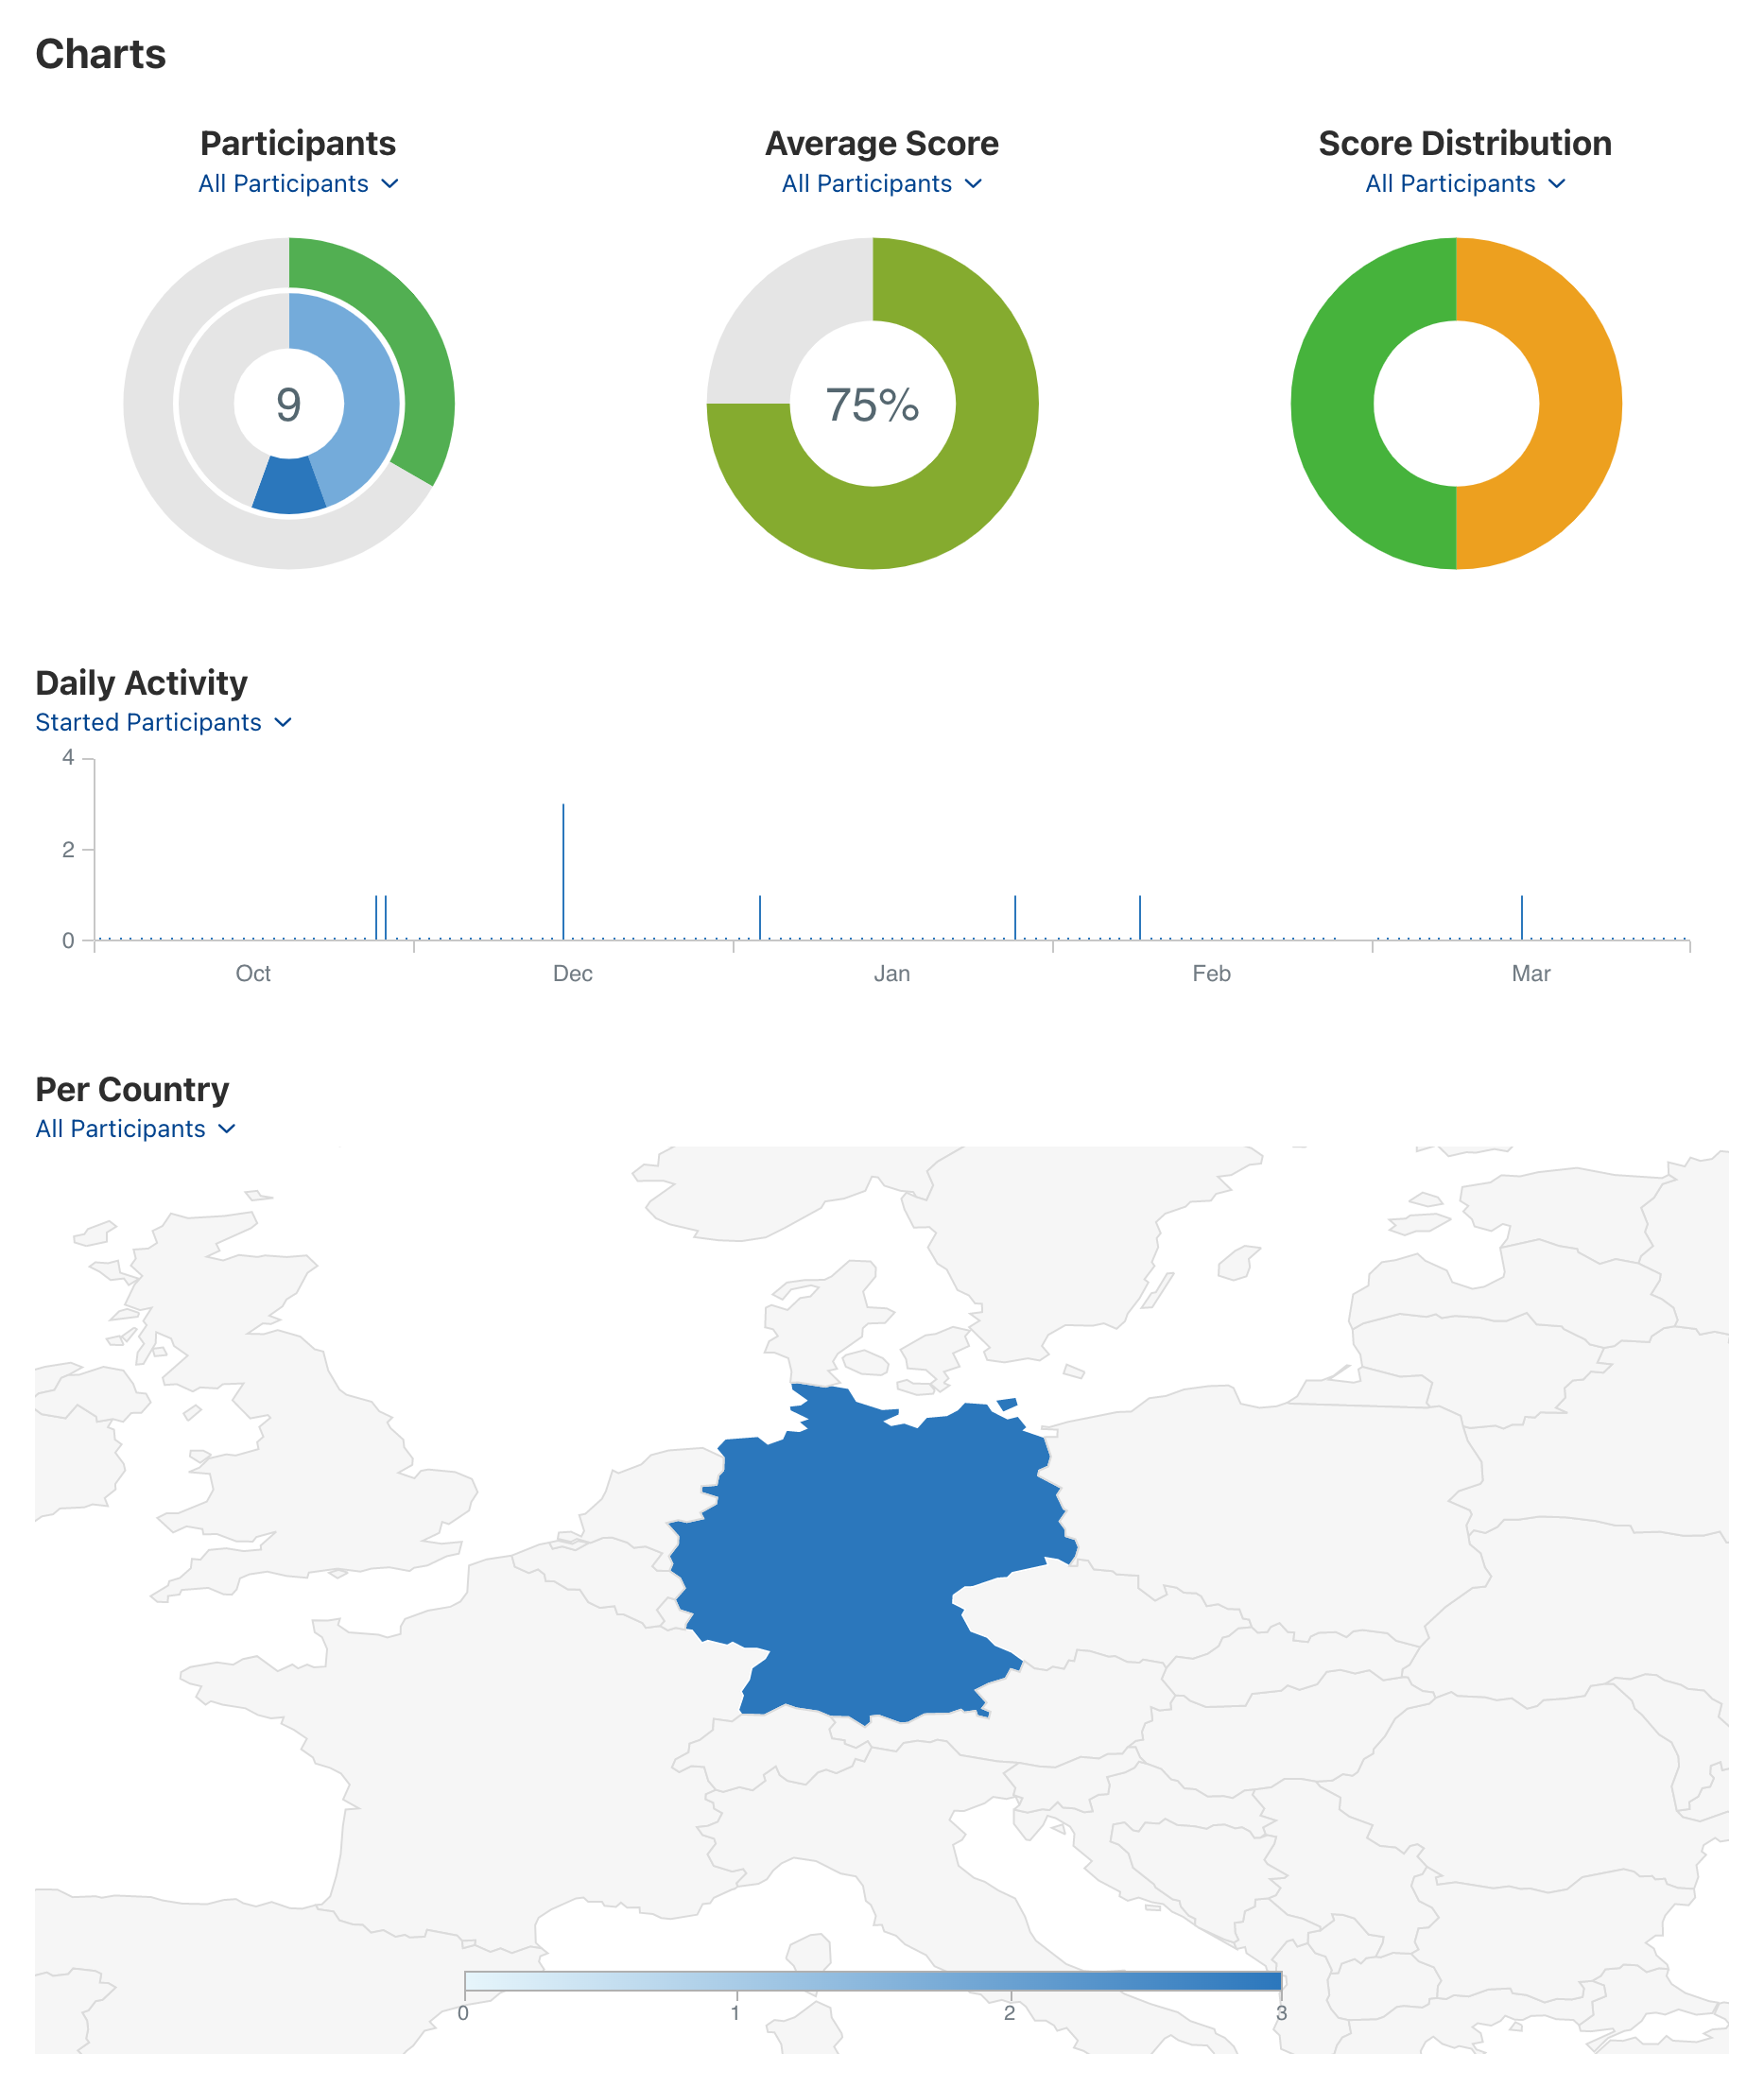
Daily activity
The area between the pie charts and the world map displays an overview of the daily activities. These include:
- Course starts
- Course completions
- New comments
- New messages
The "By country" world map
If your participants are from different countries, you can simply move the mouse over the desired country to view the following information for each country:
- Number of participants
- Course starts
- Course completions
- Average result
If your participants come exclusively from Germany and the Netherlands, for example, the map automatically zooms to this area.
Exports
The predefined reports for download can be found in the corresponding menu item under Manage course > Export.
- Result overview
- Displays the percentage and absolute number of selected answers per question. I.e. how many participants selected answer A and how many selected answer B.
- Answers (by member)
- For each course participant, an Excel worksheet is generated containing their answers.
- Answers (by question)
- For each step with a question, an Excel worksheet is generated containing the answers of all learners. •
- Learning step results (by member)
- For each course participant, an Excel worksheet is generated containing the following data:
- Member name
- Email/User name
- Organization
- External ID
- Page: Title of learning step
- Progress: 0/100
- Completed: Yes/No
- Result: 0/100
- Date including time stamp when the step was completed
- Learning step results (by learning step)
- Here, the information is reversed: For each learning step, an Excel worksheet is generated containing all the course participants:
- Module results (by member)
- This report provides current progress/score for a specific course module/chapter. An Excel worksheet is generated for each learner.
- Module results (by module)
- This report also provides current progress/score for a specific course module/chapter. An Excel worksheet is generated for each module.
General course overview
In addition to the above reports, you can also download the course participant list (academy-wide or within the course menu).
Academy-wide reports
If, for example, you want to find out which courses a particular student or group of students is enrolled in, click your profile picture and then click Reports. These academy-wide reports are only available to managers and academy-wide trainers and auditors. The logic of these reports is the same as that of the reports that you can find for a course under "Reports".